
Bells are Ringing at the Top
This will be a bit lengthy...

Before I get started, a quick positioning update:
Long a few of my June ‘24 QQQ Put spreads from 444.87, Long June ‘24 TLT Puts from 94.60 in full size still, Long May/June CL Calls/Call spreads from 69.80 & 75.57 with a bit taken off as stated in my last post.
I did say that things were heating up in markets and macro land. Looks like it’s only going to get hotter.

Taking a look at some of the key themes that I highlighted coming into this year:
Commodities will shine.
Equities & bonds will struggle.
Inflation’s death has been greatly exaggerated.
Time to dig in. To begin, I’ll refer to a portion of my 2023 Recap/2024 Outlook.
To top it off, at the last FOMC, Powell gave commodities — and equities — the greenlight to run. In what was a disastrous display of indecisiveness — and dare I say, a lack of credibility — the Fed released the animal spirits. And you know what they say, “Don’t fight the Fed.”
Regimes will continue to shift in the blink of an eye, wealth will be transferred in copious amounts, and only those who remain sagacious & nimble will prevail.
Commodities will shine.
There are waves of opportunity coming.
That greenlight from Powell has evidently turned into a flashing red light — for equities.

Taking another bit from an older post dated January 15th to expound upon this:
Commodities (GC, CL)
Signal:
The combination of escalation in the Middle East, the Fed ushering in a Goldilocks regime, and overcrowded positioning makes both gold and oil — oil more so than gold — powder kegs.3
Seasonality looks conducive for a healthy run in each commodity.
Noise:
There will be no escalation in the Middle East whatsoever. 4
Bonds & equities are the only games in town.
Time for another YTD performance check:
Oil: +13.76%, Gold: +15.96%, SPX: +4.68%, NDX: +2.22%, DJI: +1.12%, and...drumroll please, TLT: -9.24%.
It’s safe to say that not only were bonds & equities not the only games in town, but also that commodities are shining. If you aren’t convinced this will continue long-term (with some brief intermissions), walk with me for a bit.

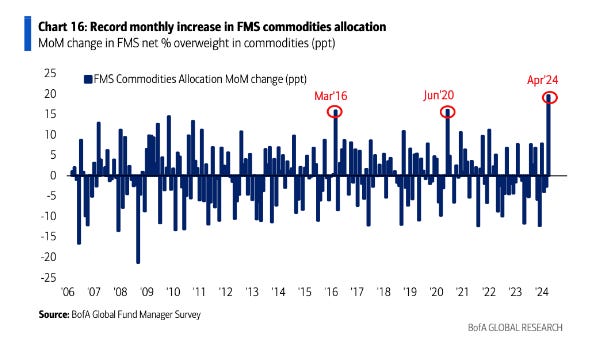
Now, these dates mean nothing without context so let me explain — by way of visual aid.
This record inflow to commodities should not be surprising. After all, we are well into stagflation territory. Since late 2022 — almost ad nauseum at this point — I’ve mentioned my stagflation first, then deflation economic outlook as my base case.
My base case scenario for 2023-2030’s economic outlook is a severe recession with high inflation, the worst of both worlds. Deflation will rear its ugly head eventually, but not before a stagflationary crisis. I believe the West is incognizant of this and will inevitably suffer the consequences of insensitivity to a monumental regime change.
The last piece to the stagflation puzzle was rising unemployment, and if you have any mind of your own you wouldn’t take the recent unemployment numbers from the BLS seriously — especially since it’s an election year and Biden needs to make everything look rosy. I still believe that we entered into the nascent stages of stagflation in Q4 of 2023:
Markets can turn on dimes as we’ve seen them do numerous times over the course of this bear market, but the economy does not. The signs of the changing economy show up over a period of many months, as it rolls over, or rejuvenates. In this instance, the economy is rolling over, and certain sectors & assets have different interest rate sensitivity.
The labor market — being one of the more salient sectors — has unequivocally been obfuscated by the pandemic, making it exceedingly difficult to read. It doesn’t help whenever the organization responsible for releasing the data isn’t being as honest as they should be, and that’s an understatement.
…Is the US really in recession? What about Q3’s scorching hot 4.9% GDP? Surely the US cannot be in a recession with an economy this hot. A recurring theme in my posts is that history often rhymes. In Q4 of 2007, which was also later declared the advent of The Great Recession, GDP was also 4.9%.
But how could this be? We know that the unemployment rate is more indicative of a recession than GDP given how in 1947 there were two consecutive negative GDP readings without a recession. And in 2001, although GDP didn’t go negative for two straight quarters, there was still a recession. The key factor in each instance was the unemployment rate. More recently, last year we recorded two consecutive negative GDP readings without a recession because unemployment was clearly too low — and still declining.
The Sahm rule is also highlighted in that post. And *checks notes* it has not only recently triggered in about 20 states, but also been disregarded by its own creator. On that matter I have one thing to say:
I know it sounds crazy, but you can acknowledge data manipulation as a trader and not allow it to override your otherwise sound decision making. See below where, despite cognizance of cooked data, I managed positions accordingly.
From the same post:
Quick positioning update:
Re-entered SPX puts on 10/19, closed over half on 10/26, and unloaded the rest on 11/1 in the early session.
Closed the last of my NVDA puts on 11/1 as well.
Closed the long vol hedge on 10/26.
Still long oil from 7/7.
Two things that were on the forefront of my mind since my last post:
The most aggressive rallies occur in bear markets.
Shorting is already difficult enough, don’t let your ego make you overstay your welcome.
Having been short indices since early August ‘23 after waiting for what felt like forever for a decent opportunity, my hands were forced to close all shorts in early November of that same year. I mention this because I was all but certain that 2023 was going to be another down year for SPX, and near record high dispersion ruined those plans.
This miscalculation was ultimately a blessing in disguise and I’ll explain why. Time to dip into some of my more recent posts. From March 16th, 2024:
There’s been a rotation happening underneath the hood for a bit, notably in energy and consumer staples.
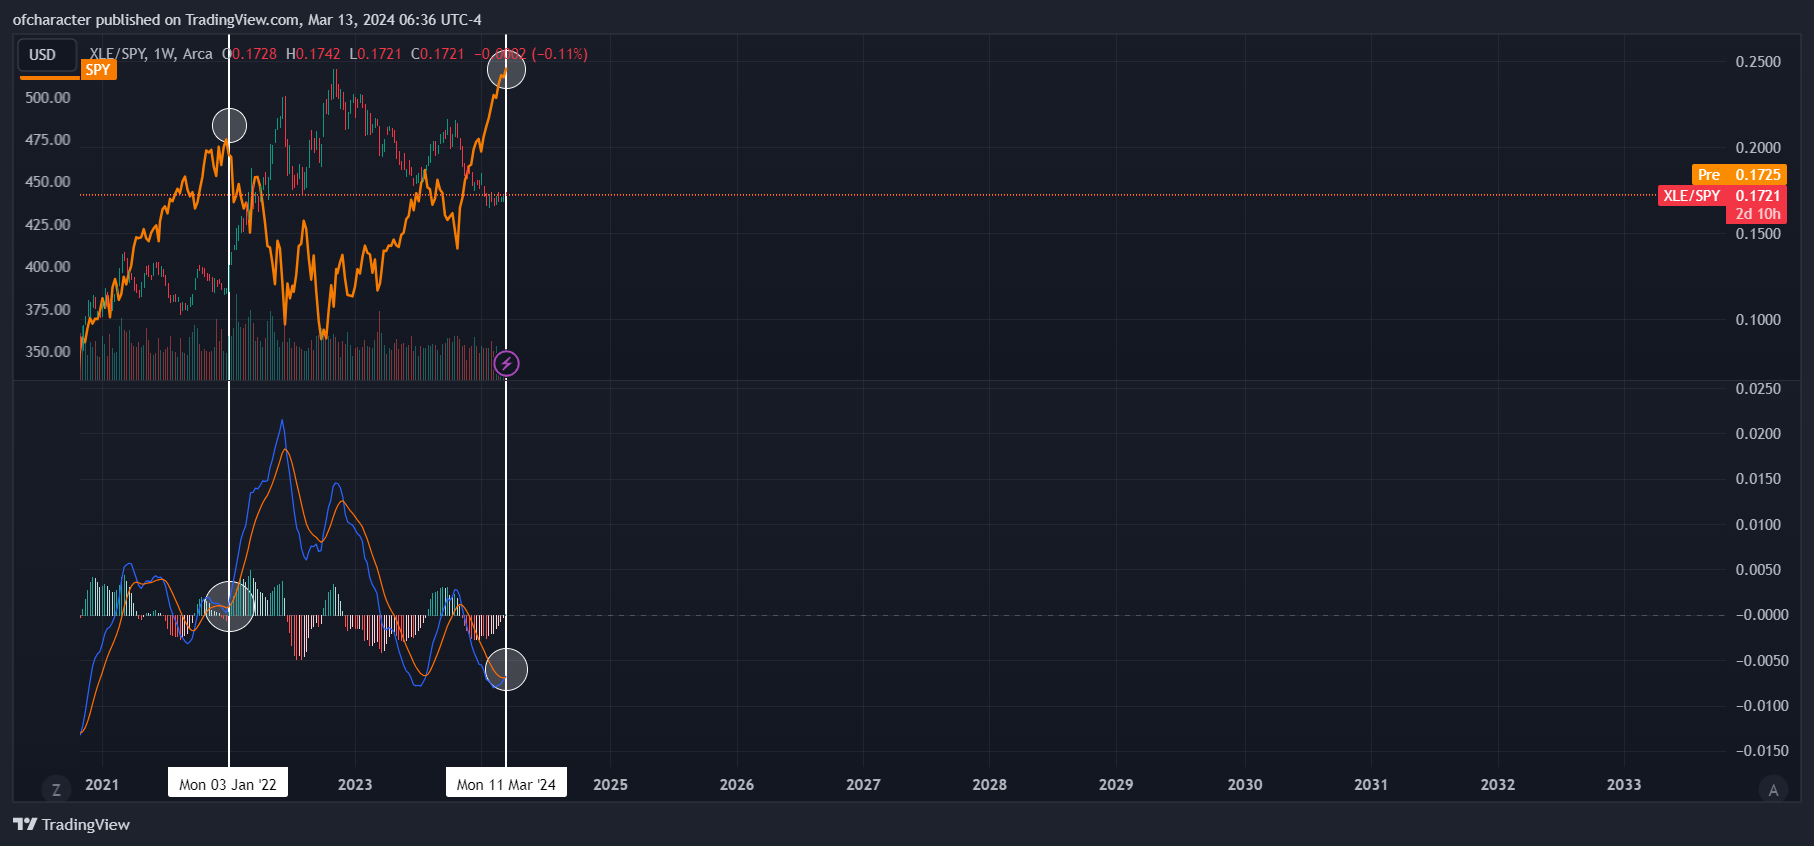
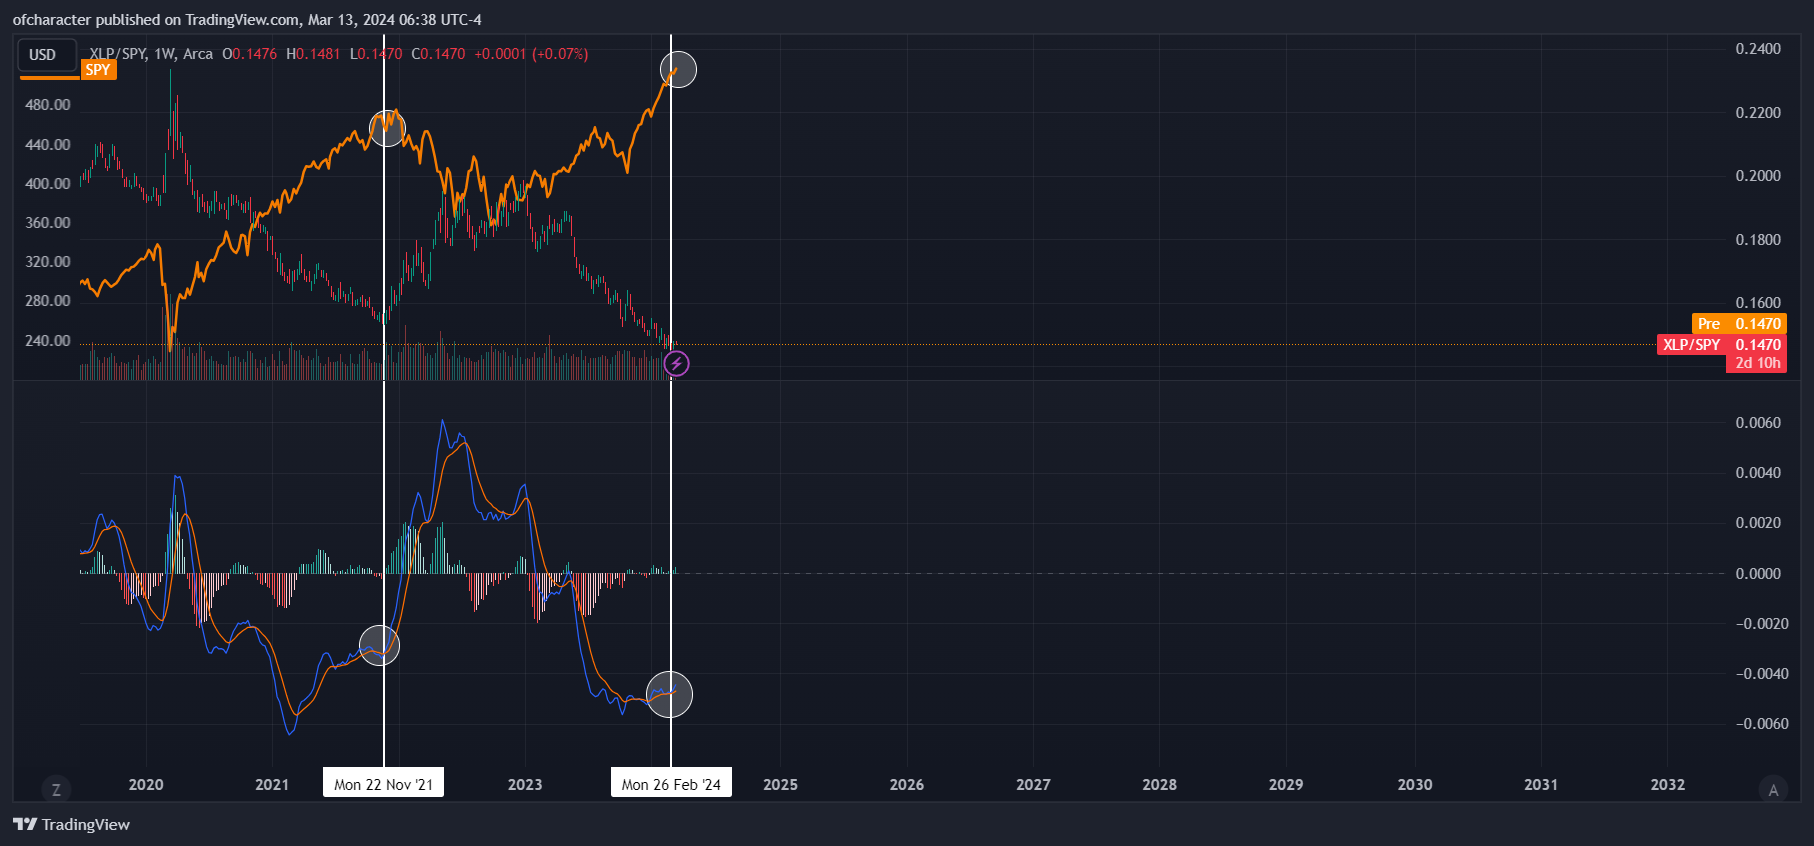
As you can see, this doesn’t really bode well for equities in the near future. This rotation is a reason why 30% of my port is in energy/oil right now.
Rotation check:
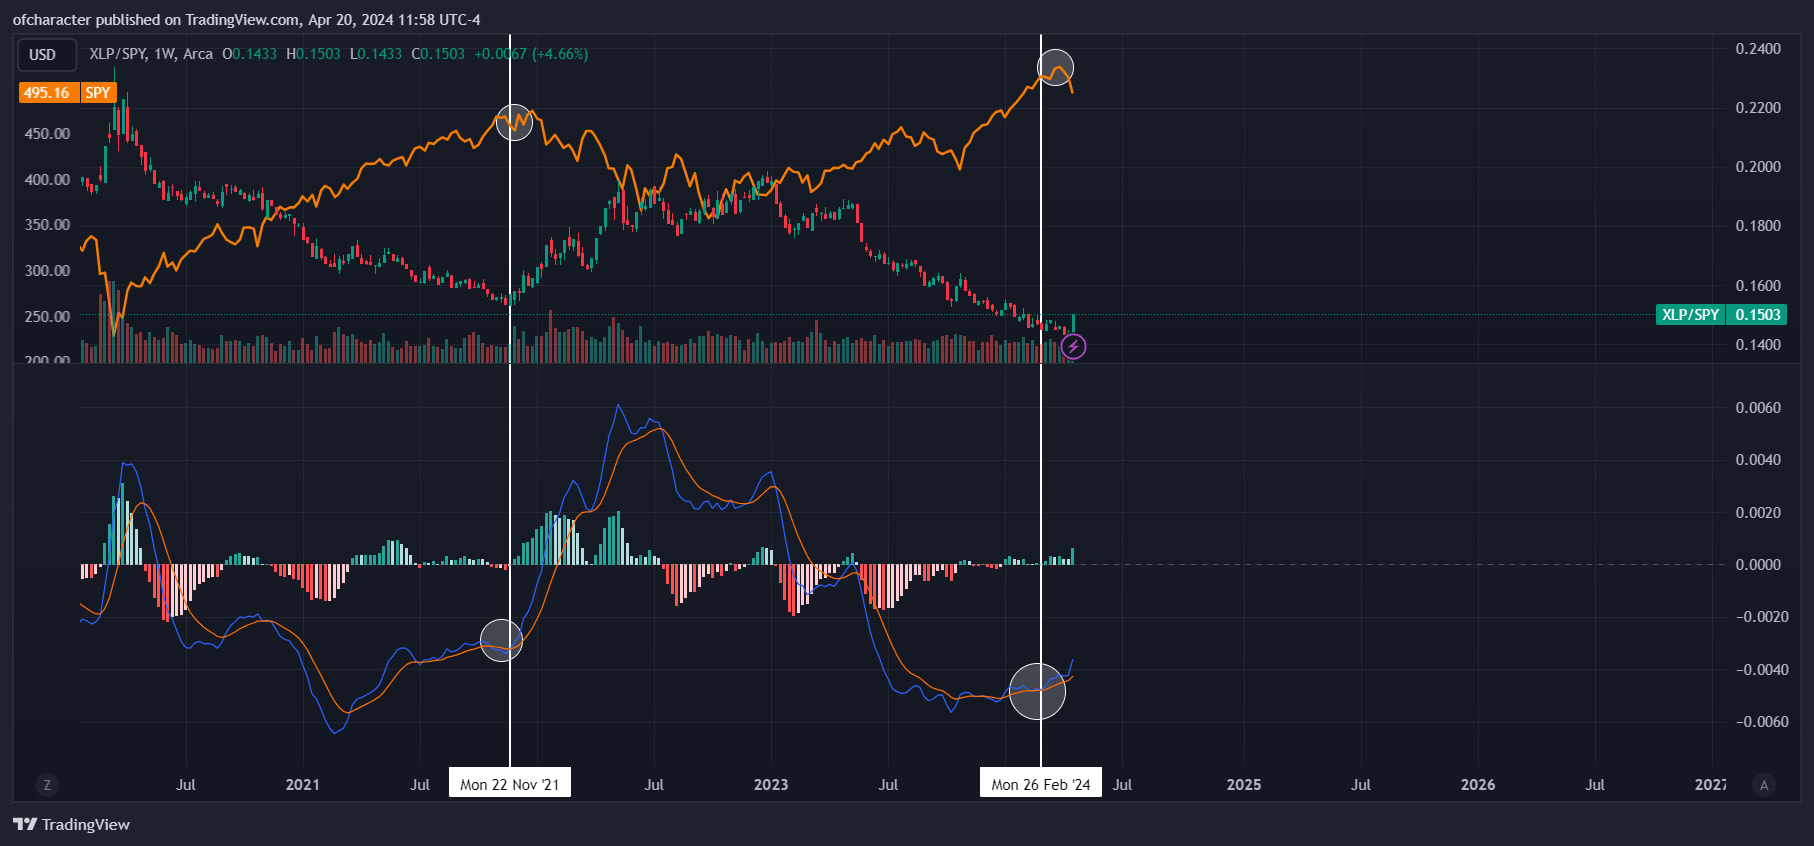
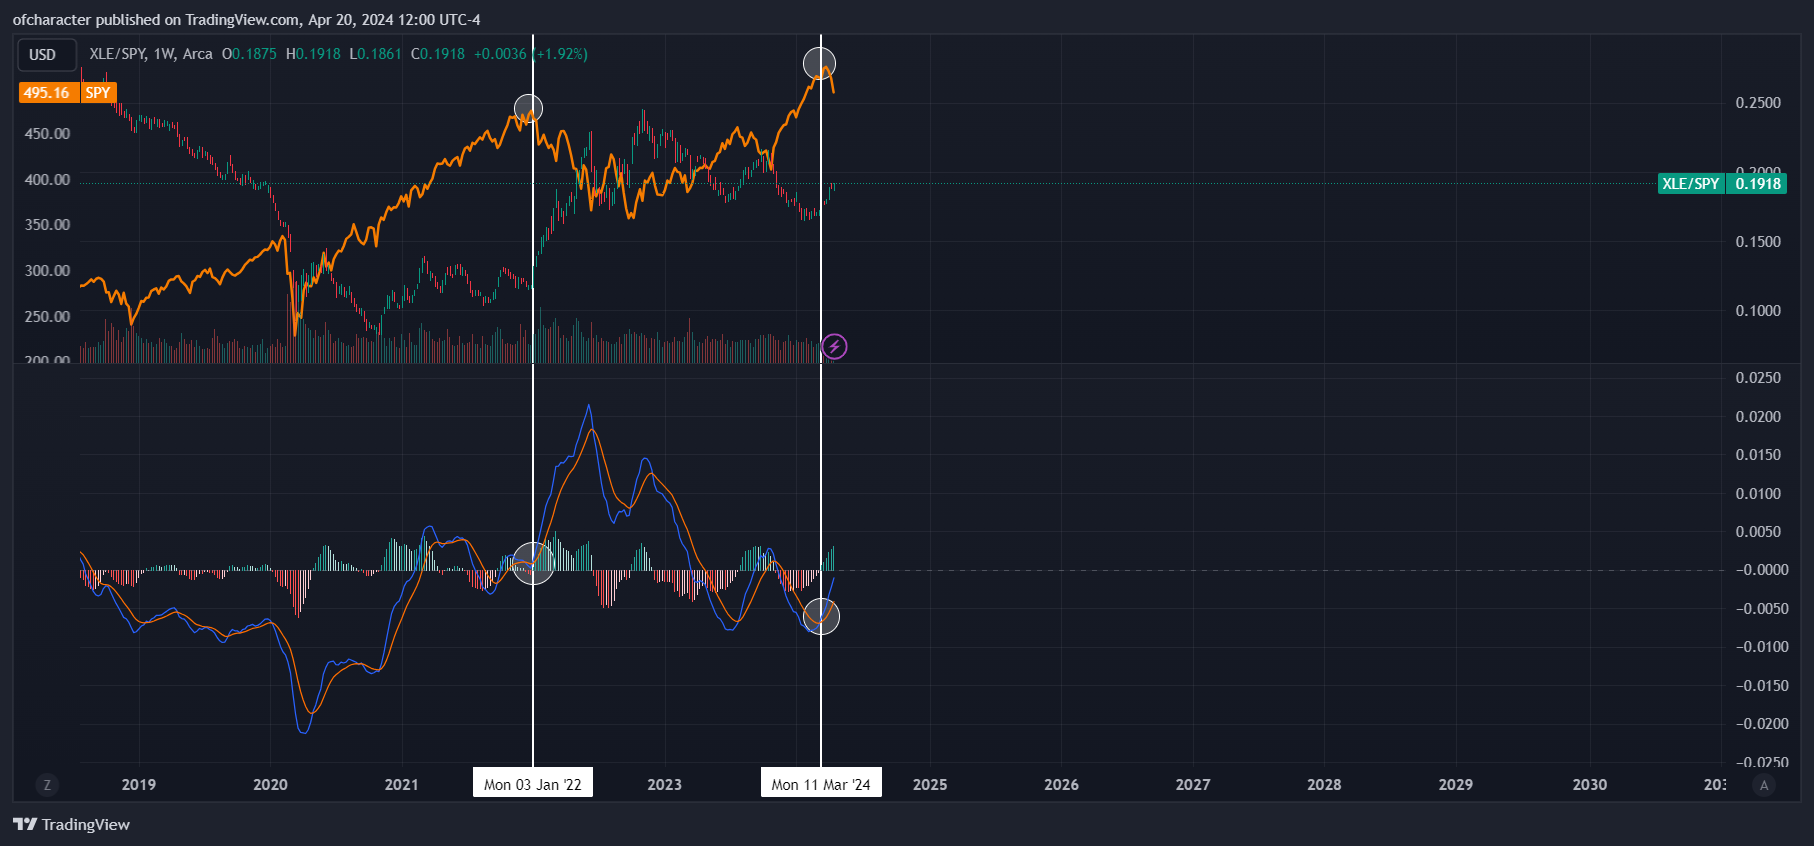
This looks really familiar, doesn’t it? Remember the adage “tops are a process, bottoms are an event.” Hence the stagnation in indices for over a month. If it’s not already clear, I am alluding to the idea that we have seen the highs for the year.

I understand this sounds crazy because it’s an election year and this couldn’t possibly be true, but I vehemently disagree with that sentiment. Take a good look at those charts above again, and then compare them with the ones that I will present below:

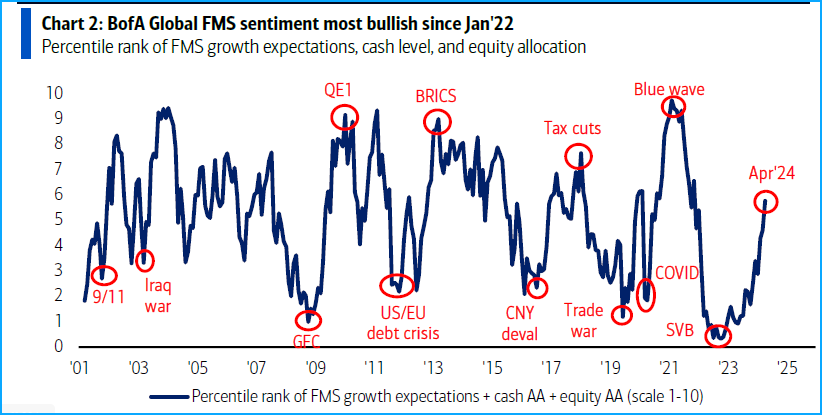

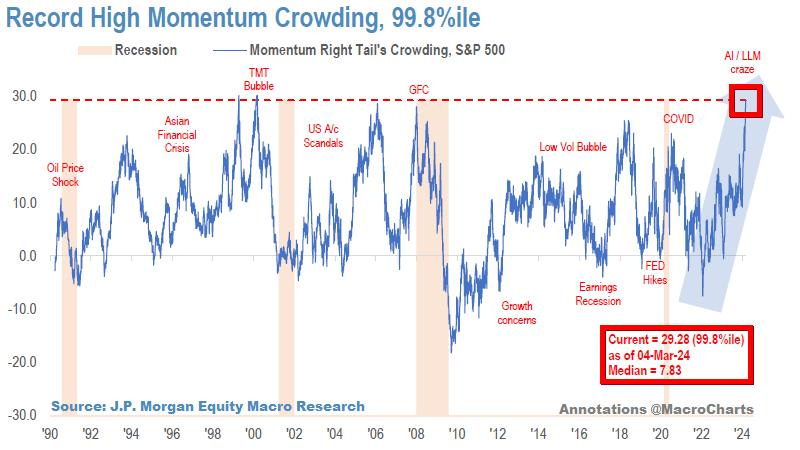
This is my favorite chart because, of the three times that momentum crowding reached this level, two of them marked annual tops. As for the one in 1998 that didn’t, I believe that was due to the unbridled support for LTCM so as to prevent the markets from collapsing. Good ole USA, that’s what we do baby.
You may be asking: “Won’t they be able to get away with this again?” NO. Absolutely not. Since Powell’s disastrous December pivot led to inflation’s prolonged persistence/resurgence, any major to-the-resqueesque policies can be kissed goodbye. It would only serve to further damage both equities and bonds. Besides, Powell recently said, and I quote:
Recent data show lack of further progress on inflation.
Appropriate to let policy take further time to work.
Will likely take longer for confidence on inflation.
This is a significant change of tone from earlier this year. He is willing to let rates — the long end specifically — do the tightening for him again. That being said, let us not forget about the correlation between oil & the 10y:
I didn’t mention the energy/oil portion of my positioning last time because not much has changed, but this time around it’s paramount to note. So, in from CL 69.80, added at CL 75.57, and have taken a bit off since. Oil’s been very good to me since December 13th, and it looks like this will continue for the foreseeable future.
Why is this important to note? Because oil is closely correlated with the 10y/long end/breakevens, and the 10y chart should have all eyes on it right now.
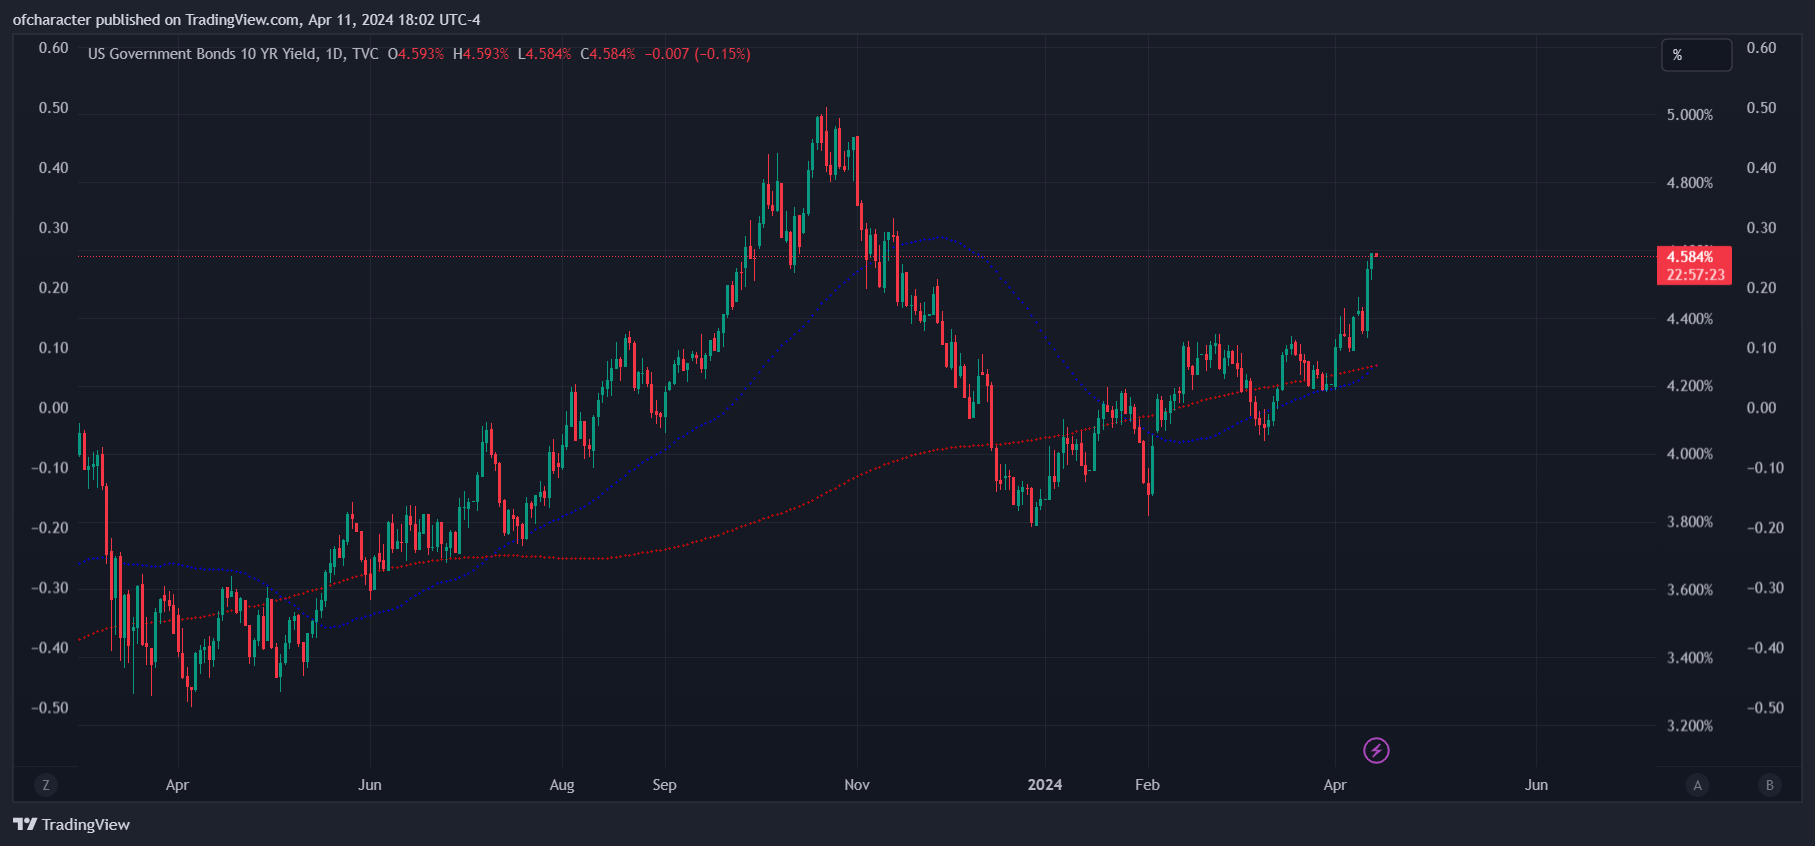
The golden cross that formed in the 10y last July led to an interim top in equities.
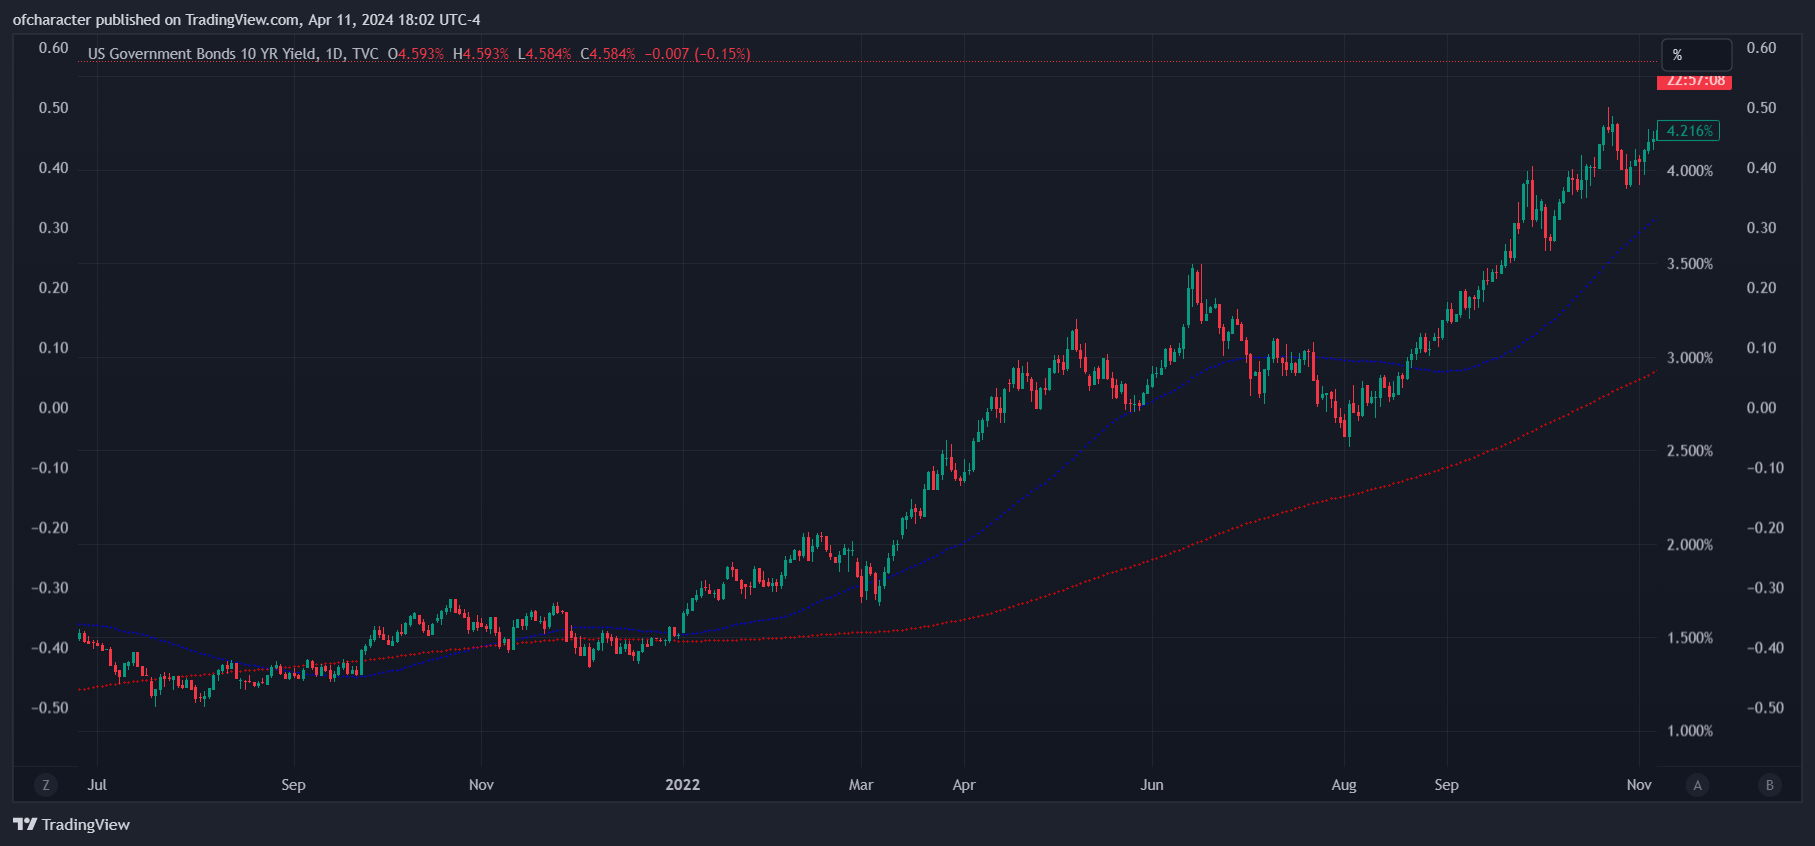
And the one in Nov ‘21..well we know how that panned out.
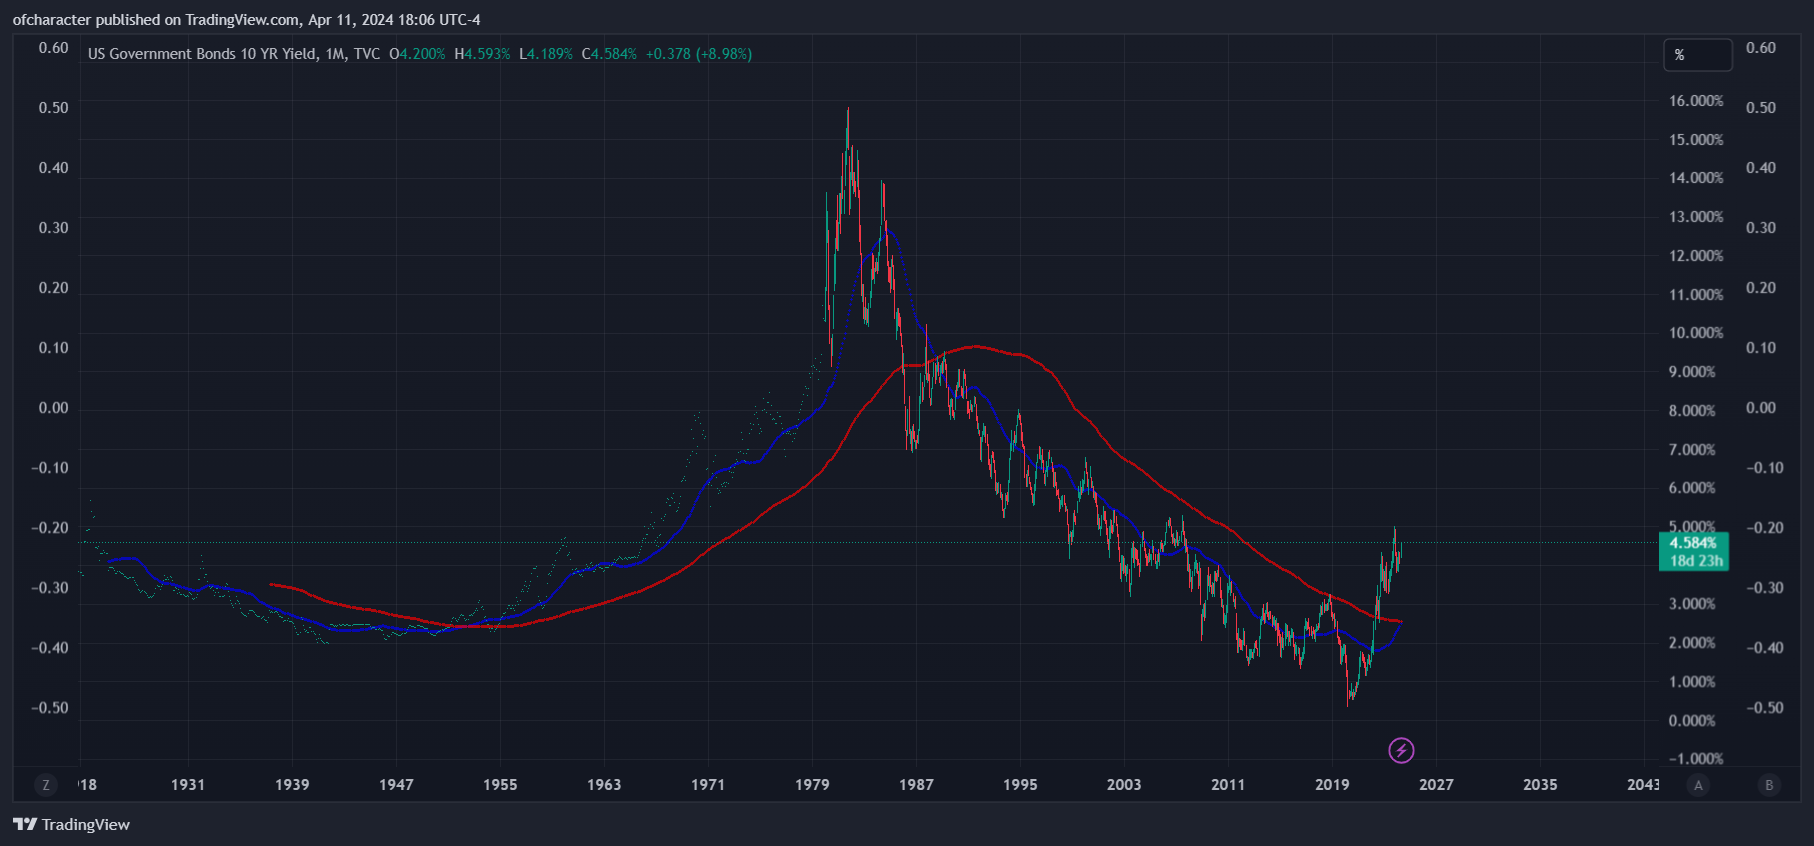
Lastly, on the monthly chart, for the first time in decades there is a golden cross forming for the 10y. Talk about a regime change.
I regret to inform you that the golden cross on the 10y daily has been confirmed. In fact, it was confirmed *checks notes* the same day that both SPX & NDX closed below their 50MA — a first in 5 months for SPX. Once again, we are firmly in STFR mode with the wrecking ball — rates (bear steepener), USD, and oil — leading the way.
In conclusion, traders have been trained Pavlov style to buy every dip over the past several months because new ATHs awaited them almost immediately. However, a new trend has been confirmed — reaccelerating/sticky inflation. Disinflation (not inflation lol) is transitory.
Equities have finally started to pay attention to the red lights flashing from other asset classes. The pain trade is still clearly down, and there is plenty of supporting evidence for an annual topping in late March for the indices.
That’s all for now.
Until next time,
Pierre.