
Beware of Complacency
Inflation for October was 7.7% y/y. This is a .5% decrease from September’s CPI release. The market’s reaction to a miniscule downtick in…

Inflation for October was 7.7% y/y. This is a .5% decrease from September’s CPI release. The market’s reaction to a miniscule downtick in persistent inflation for one month is a testament to how unhealthy this market is. The pivot fanatics unleashed hell on Twitter taking premature victory laps, as is customary.
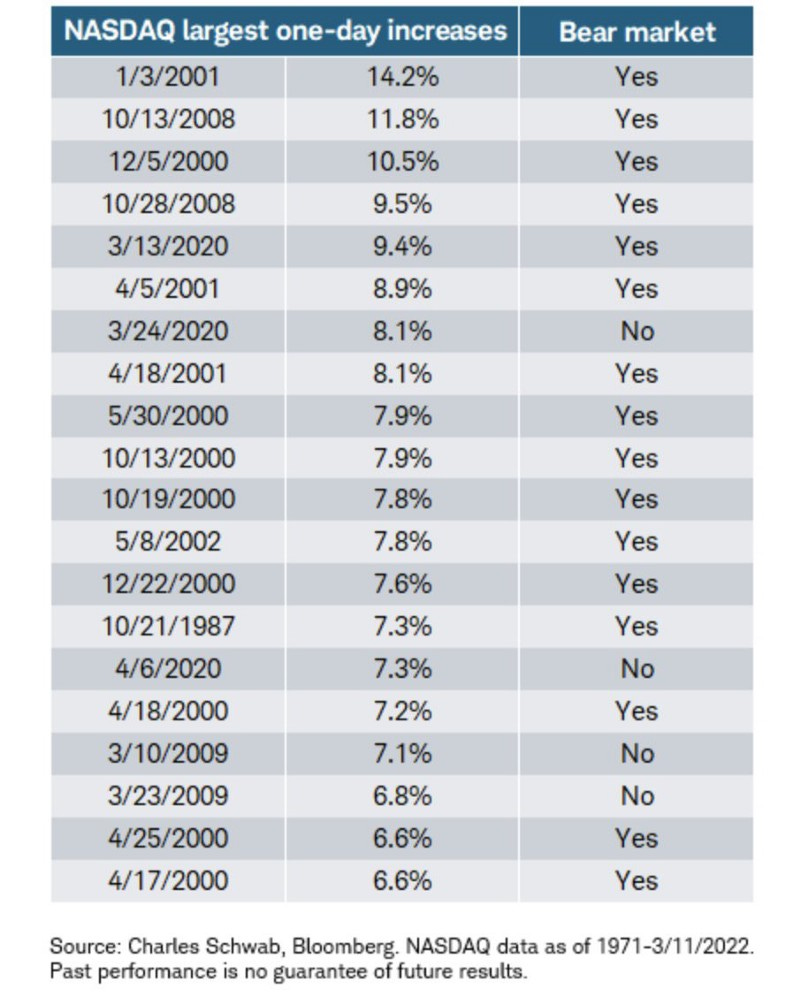
Their obstinance forbids them from being able to separate the signal from the noise in a key period. The biggest one-day increases occur predominantly in bear markets. The signal here is that this is standard bear market behavior, while the noise is that this is a bottom because inflation has purportedly peaked, and the Fed will certainly pivot (again).

Being bereft of historical bear market knowledge leaves market participants susceptible to substantial losses. We’ve seen this pattern play out several times already this year, much to the chagrin of the pivot enthusiasts.
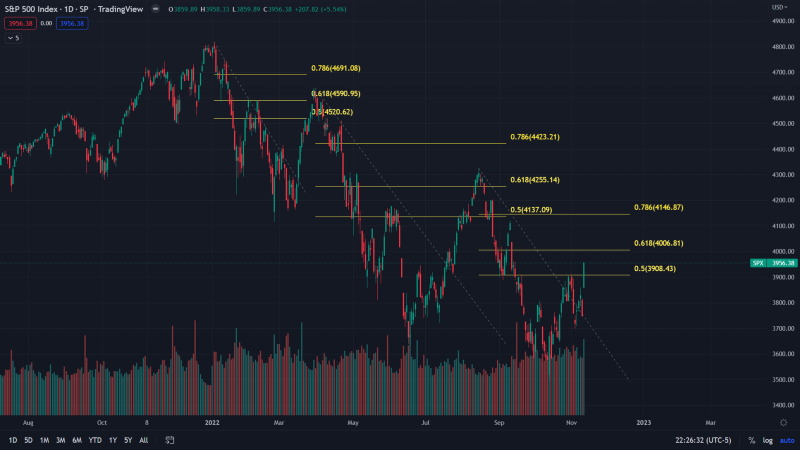
Each rally has commenced because of widespread blind optimism, only to fizzle out when the bears have turned bullish. These rallies continue until there is unanimity in opinion in which the majority are thoroughly convinced that this is a new bull market. The July/August rally begot several articles proclaiming that we were in a new bull market. Similar articles that share the same sentiment are being published again.
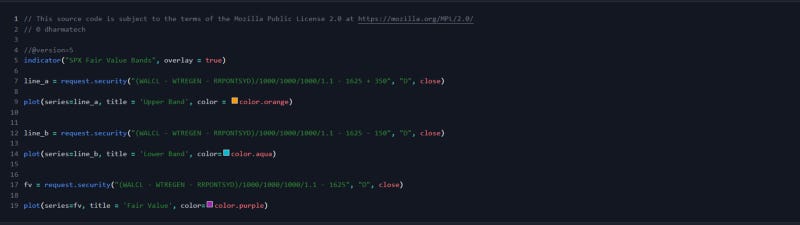
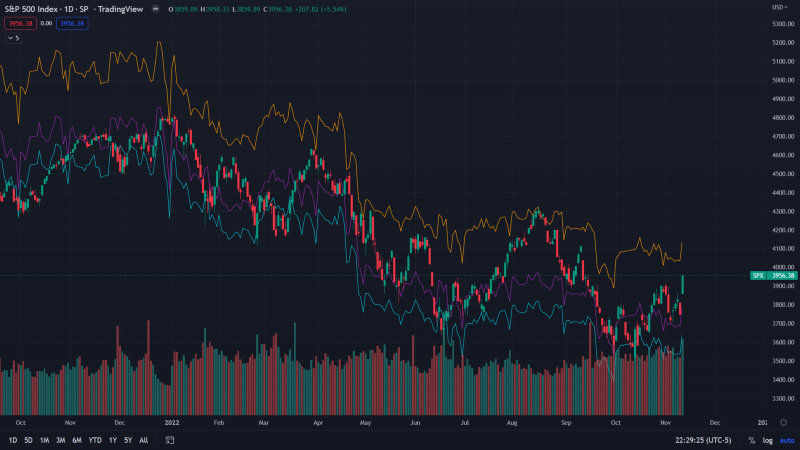
Aside from the reliable Fibonacci retracement, the SPX Fair Value Bands have consistently provided essential confluence. Max Anderson created them 2 years ago in a response to the unprecedented profligate fiscal and monetary policy in 2020. The fair value is based on net liquidity. Net liquidity is calculated as shown below.
To appropriately utilize this indicator, all you need to do is short when SPX touches the top fair value band and cover when it reaches the bottom.
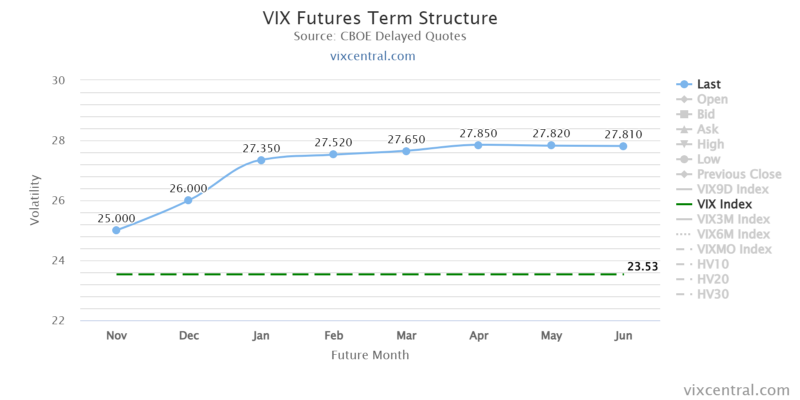
VIX’s term structure is another indicator I use to give myself confluence on trades. In turbulent periods it is not uncommon to see the front end of the curve in backwardation. This means that there is uncertainty amongst market participants. I looked back at the curve during the previous midterm elections in 2018 and I noticed that the front end of the curve was in backwardation.
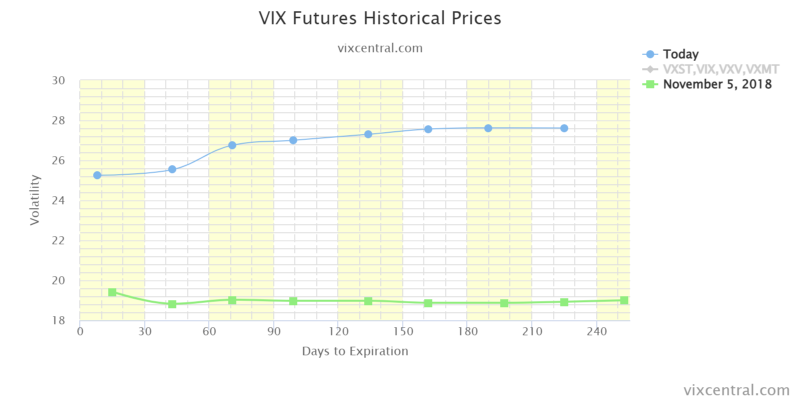
VIX’s term structure was in contango ahead of FOMC and the midterms. This is indicative of an absence of uncertainty despite this exceedingly tumultuous environment. We are in fool’s paradise. It remains in contango today.
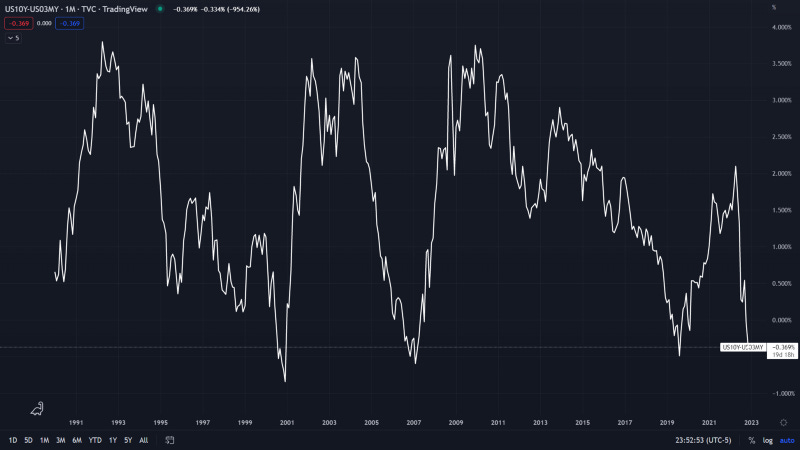
Let us not forget about the beloved 10y-3m spread. This is the more reliable leading indicator of recessions. It appears that it has now definitively inverted and a recession in 2023 looks all but inevitable.
This rally’s commencement clearly didn’t sit well with Jerome Powell. It was distinctly evident that this occurred much to his chagrin at the FOMC in early November. We will most likely see that the red wave is coming to the financial markets instead of the polls this year. Ultimately, I see the continuation of this nonsensical rally as an early Christmas present and will look to add shorts around 4040,4100, and 4150.