
Fragility, It's All One Trade
Vol is b...okay I won't say it again.

For a moment, the market was quite resilient in the face of inflation and tariffs. That was not as “insane” as it may have seemed. Put simply, 1) flows have trumped macro many times before, and 2) a growth scare is more of a risk to markets than inflation is presently — and no, this doesn’t mean inflation is dead. Bonds’ & the dollar’s recent performances are a reflection of this shift. I believe that a growth scare at this stage is also likely to trigger correlation unwinds (think growth/value, xle/ndx, rty/ndx, yen carry, etc). Along with a growth scare, Fed cuts (even the increased expectations of them) can also commence this process. This took place July 11th, 2024, when a soft CPI gave the Fed the room it needed to begin cutting rates consequently forcing several crowded trades to unwind via degrossing.
Speaking of which, ahead of Feb VIXperation, I found myself referring to the July/Aug episode almost non-stop. Implied correlation was flirting with 0 again as positioning became increasingly stretched into a period of seasonal weakness. Most notably, distribution had been transpiring for months. This is the biggest difference between the two periods. Now it’s time to put the pieces of the puzzle together.
Fragility
It’s all one trade. Allow me to expound upon this. I will use a bit of help from my pinned post to do so:
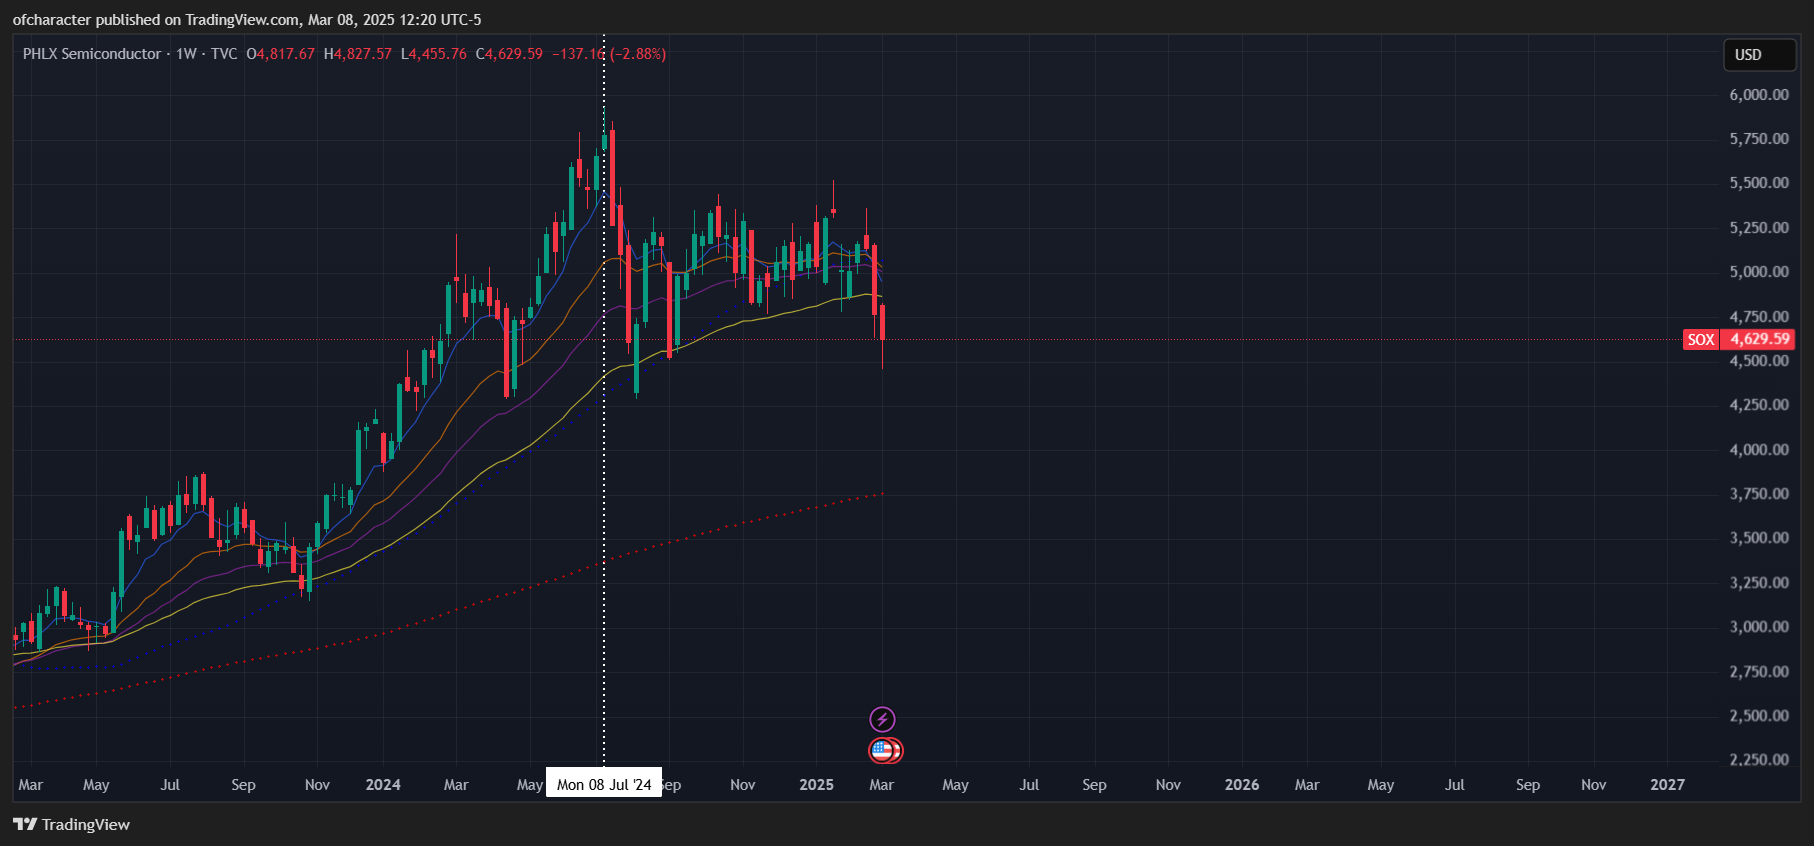
“AI fever has taken the world by storm since May 2023. Consequently, semiconductors have performed exceptionally well over the same period. Needless to say, they are highly cyclical. Semiconductor cycles are triggered by a combination of demand surges, overinvestment, and macroeconomic shifts. Notably, there is a significant correlation between GDP and a semiconductor cycle. As I noted back in Q3 of ‘23, growth likely peaked, and I believe this will hold up. Growth is likely to be relatively stagnant for the foreseeable future, but nothing reminiscent of a deflationary bust.”
The correlation between semiconductor cycles and growth is most salient here. Typically, semiconductor stocks lead both the upturns and downturns in profitability by 3-6 months — stocks are discounting mechanisms after all. Bypassing the case for a peak in sales (which can be seen via TSMC, MU, AMD, etc), semiconductor stocks peaking last July is, in my view, also indicative of a peak & cyclical downturn in growth. On top of this, all of the major CB’s are doing QT — Fed, ECB, BOE, BOC, & most recently, the BOJ.
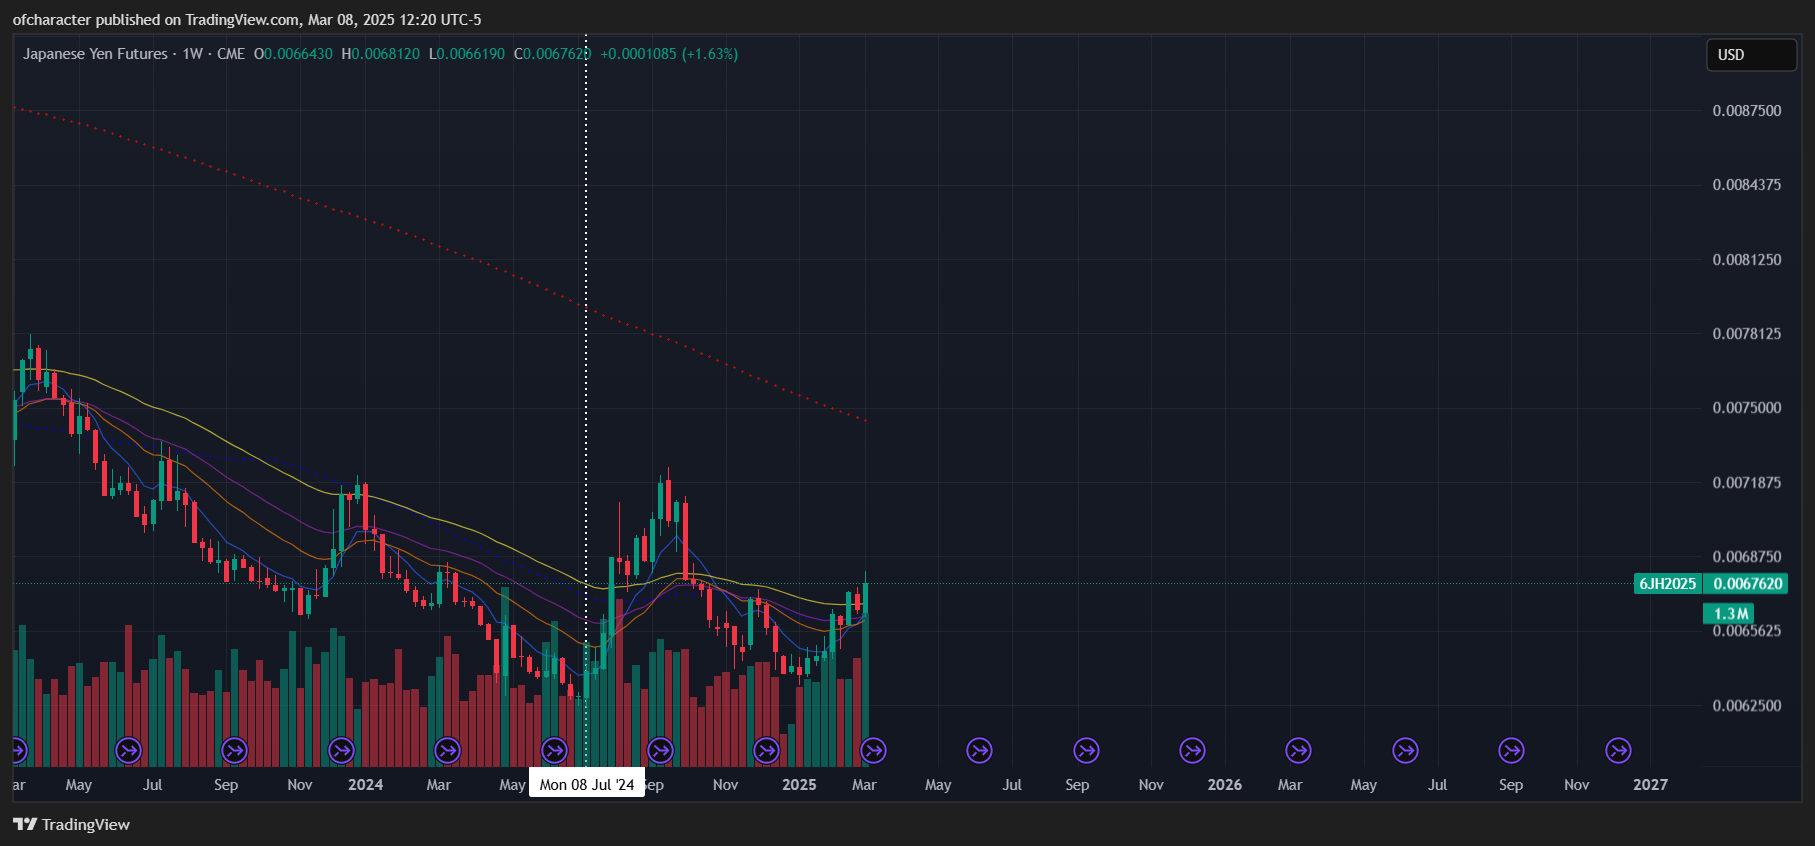
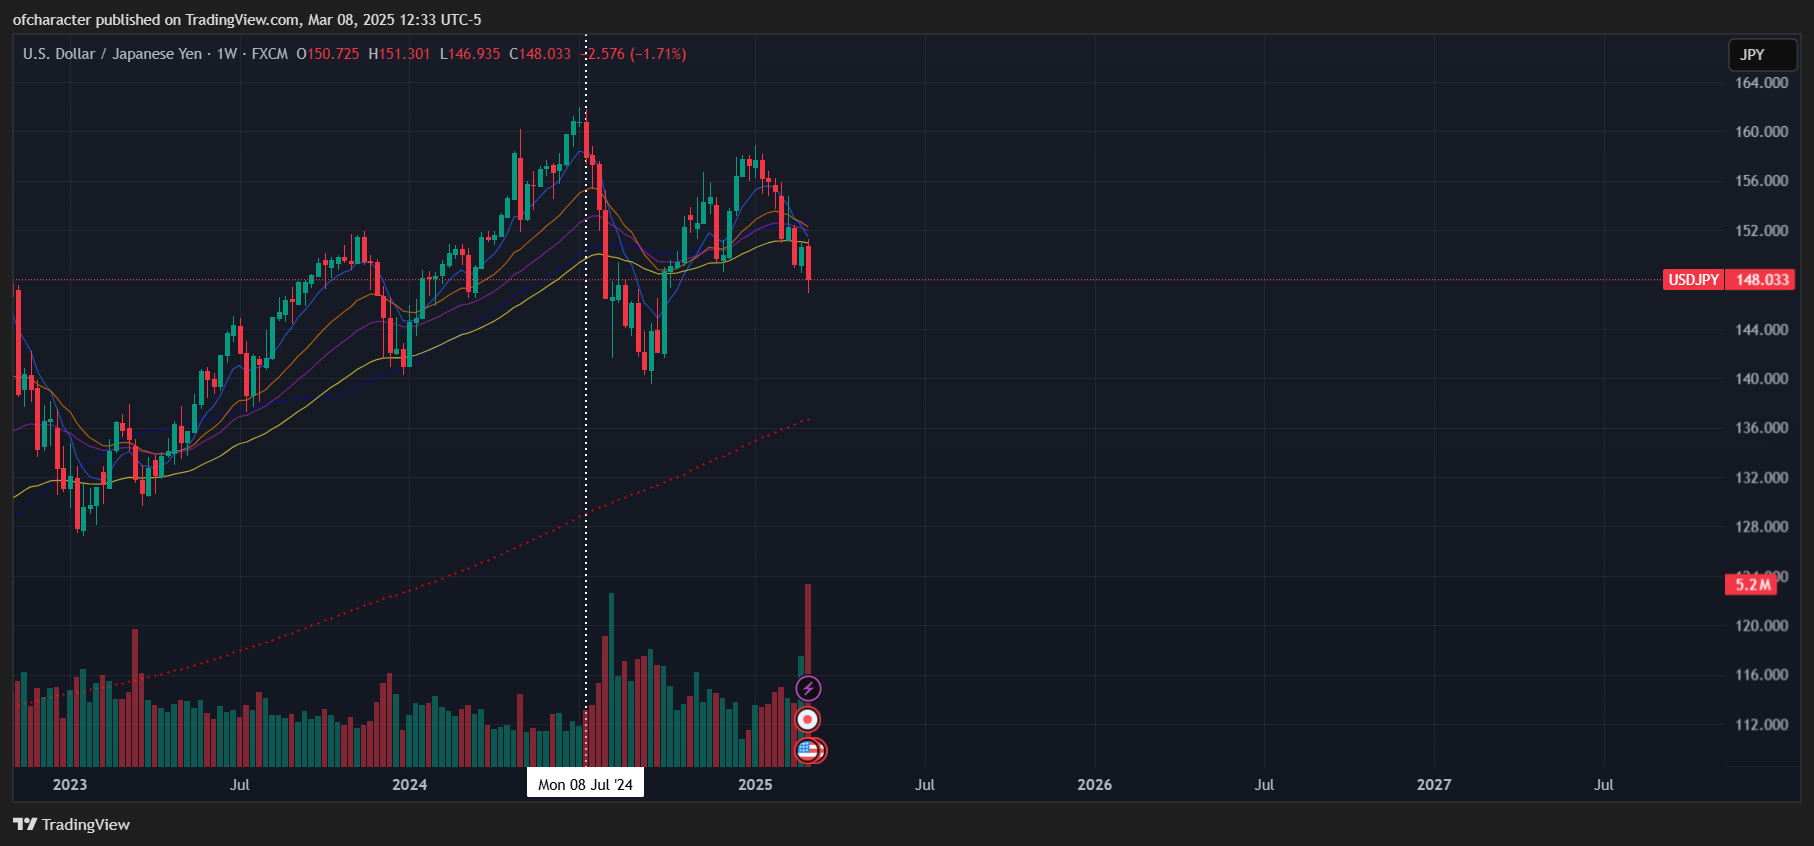
The BOJ has an inflation problem that makes it exceedingly disadvantageous for its monetary policy to remain overly accommodative. While the Fed, which is dealing with a mild version of stagflation, has paused with a bias toward easing (a catalyst is needed and Fed policy is asymmetric). This dynamic is just one of several that contribute to a stronger yen and eventually a further unwinding of the yen carry trade.
The yen carry trade, which is essentially short vol, has a funding currency with low/negative yields (the yen) and a target investment with reliably high returns (AI/semis). As of late, JGBs have been falling in response to the regime shift in monetary policy, the yen’s been strong, and the AI trade has evidently lost steam.
It’s all one trade and what’s intriguing to me is that you can see this in the markets. Where exactly? To that I say, here:
Here:
Here:
Here:
And here:
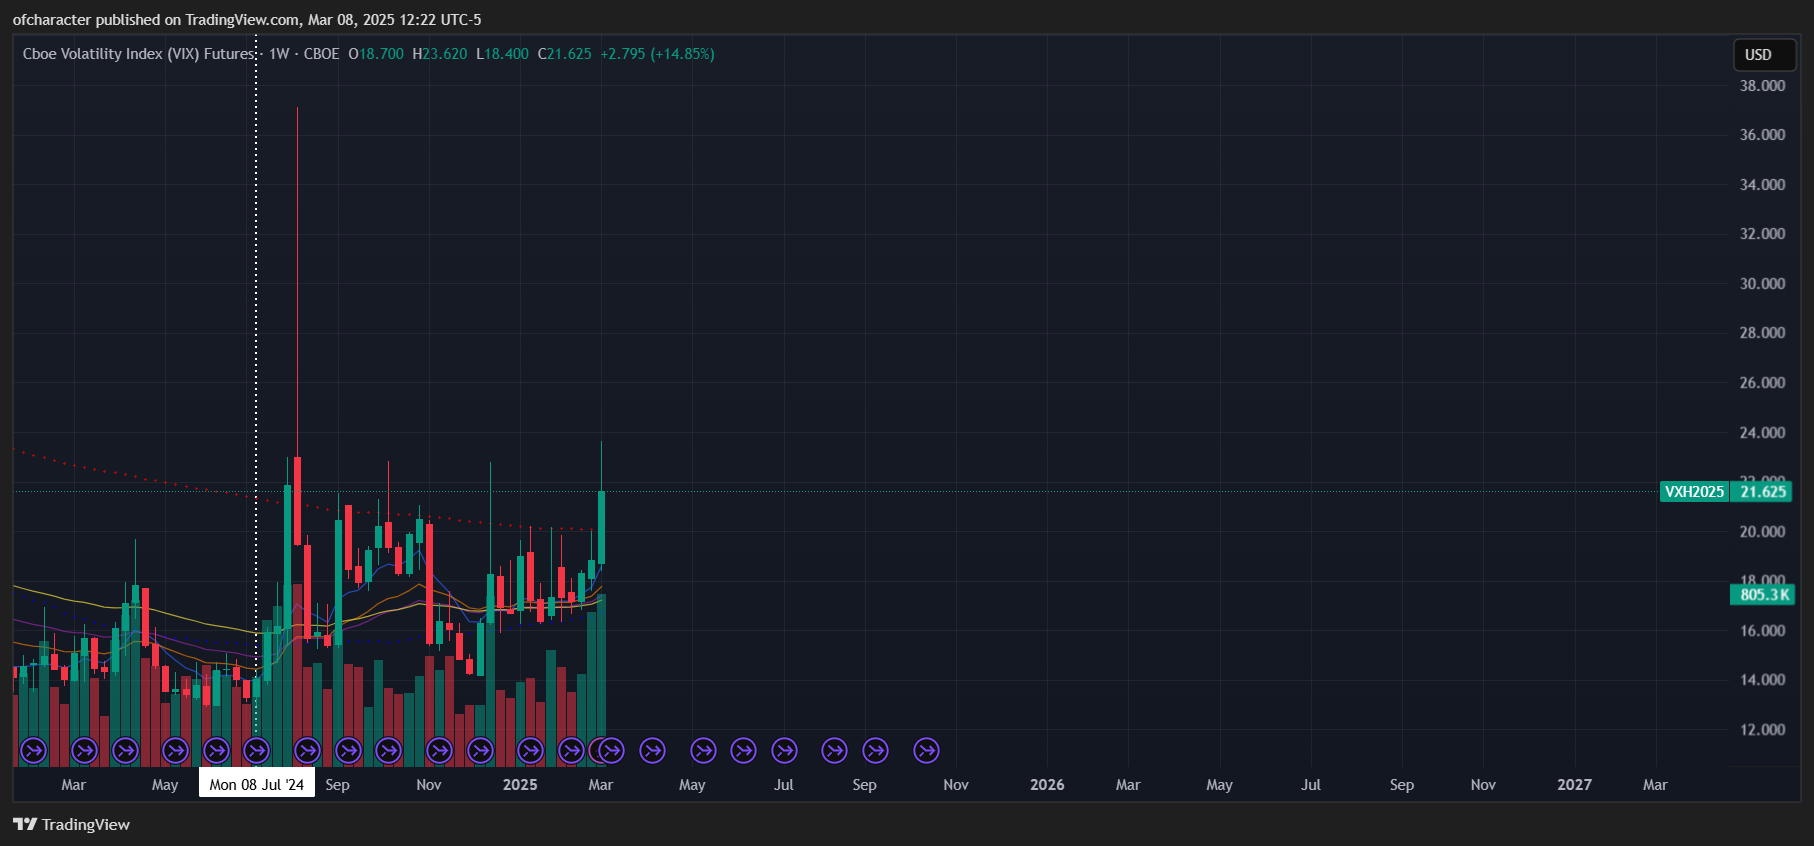
Ah, I almost forgot. And here:

Global QT with Japan as the focal point is highly likely to continue inducing volatility.
More Fragility via Positioning
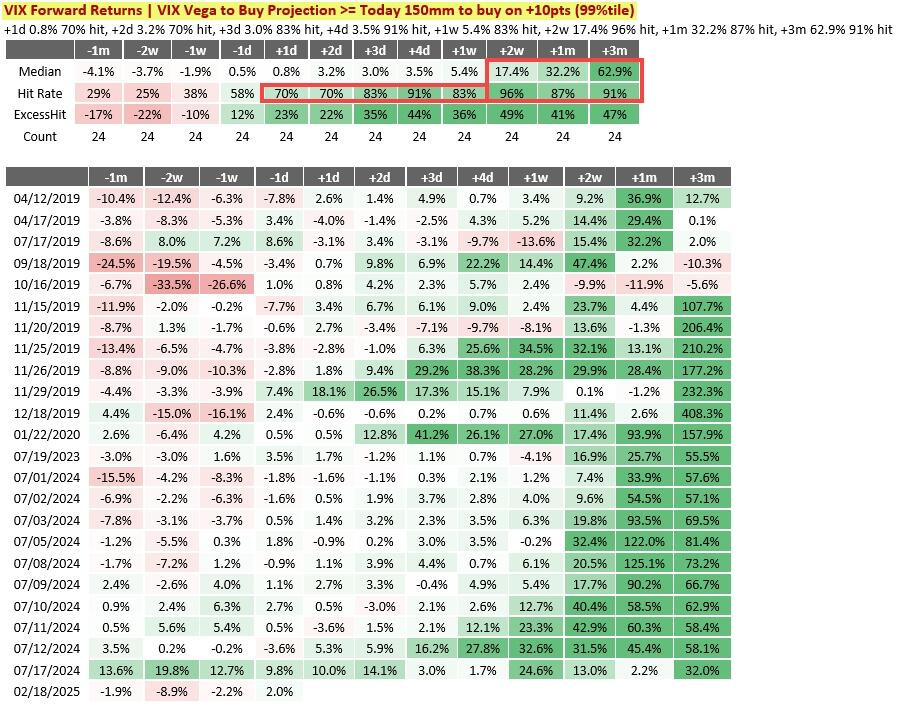
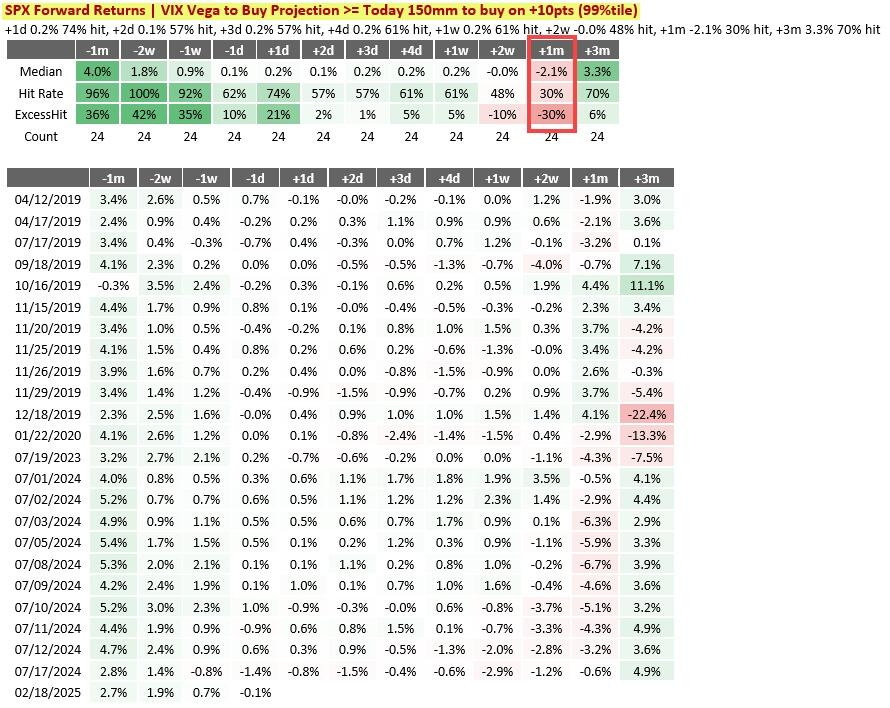
To piggyback off of the positioning section in my last post, some valuable info from volumeleaders:
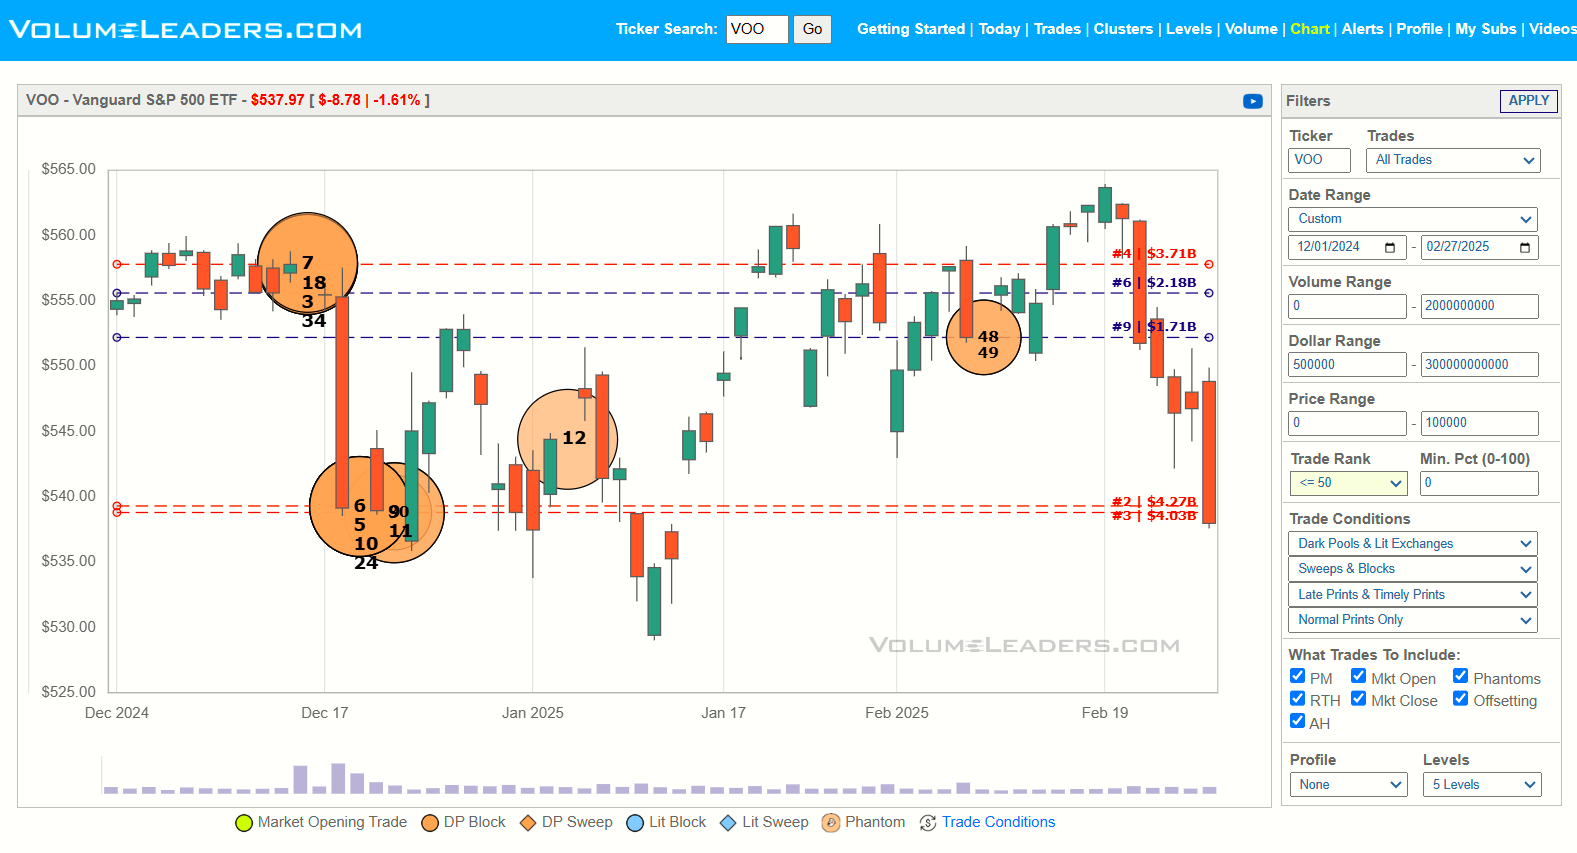
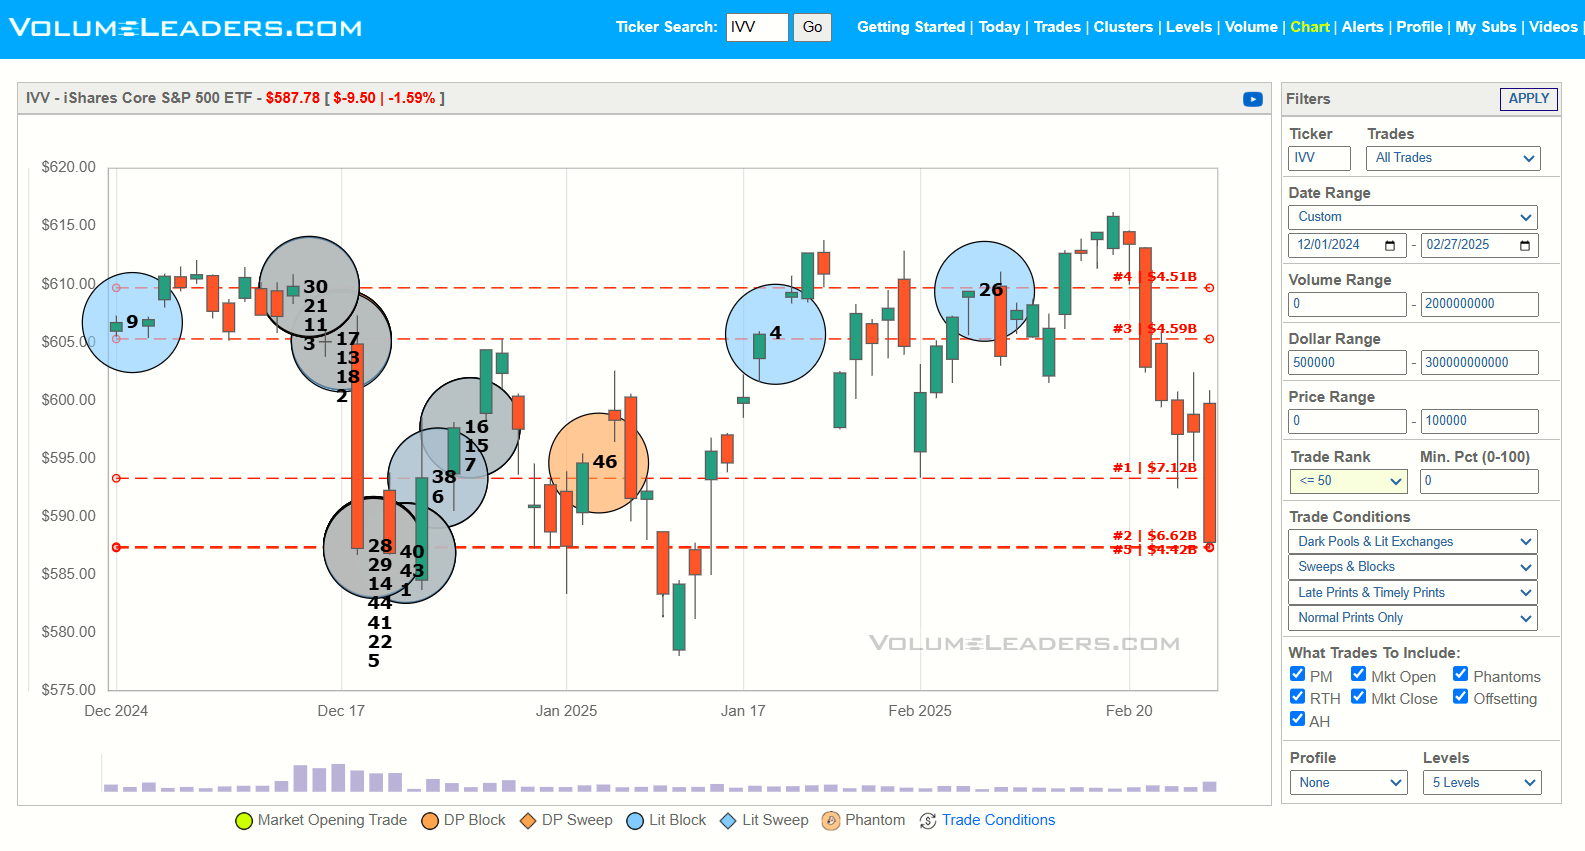


These, along with the aforementioned signs of distribution, have my eyes wide open. This process seems to have reached a culmination and I find it very hard to believe that this has occurred only for equities to quickly surge back to ATHs.
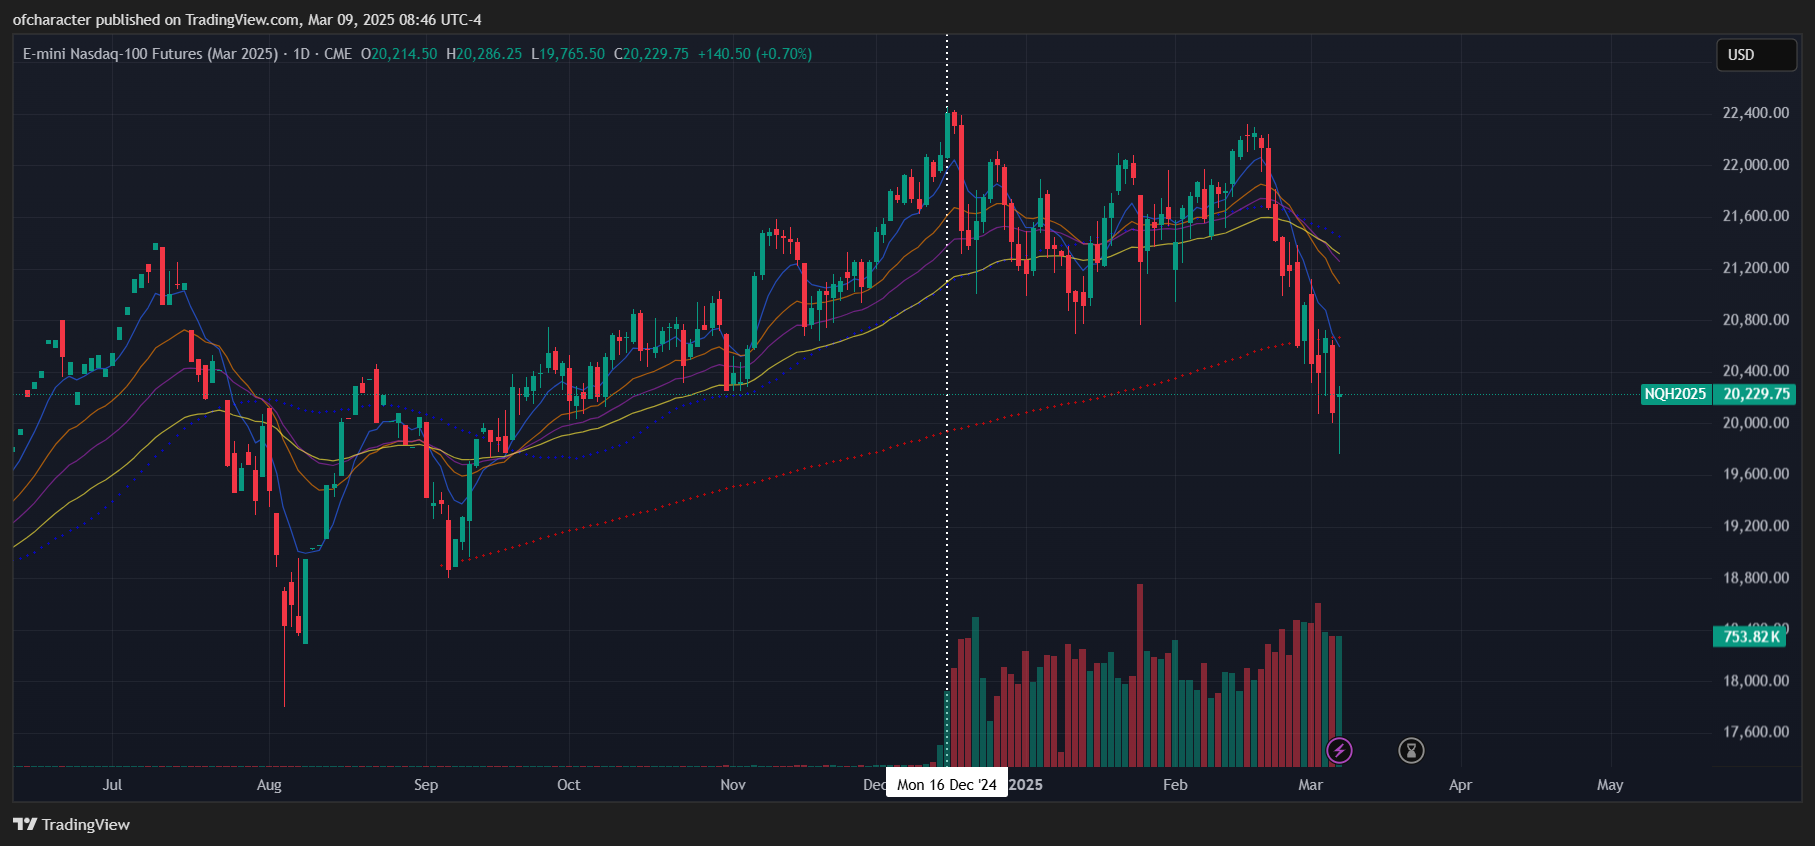
Can’t forget about how futures haven’t made new highs since December despite cash making new highs in February.
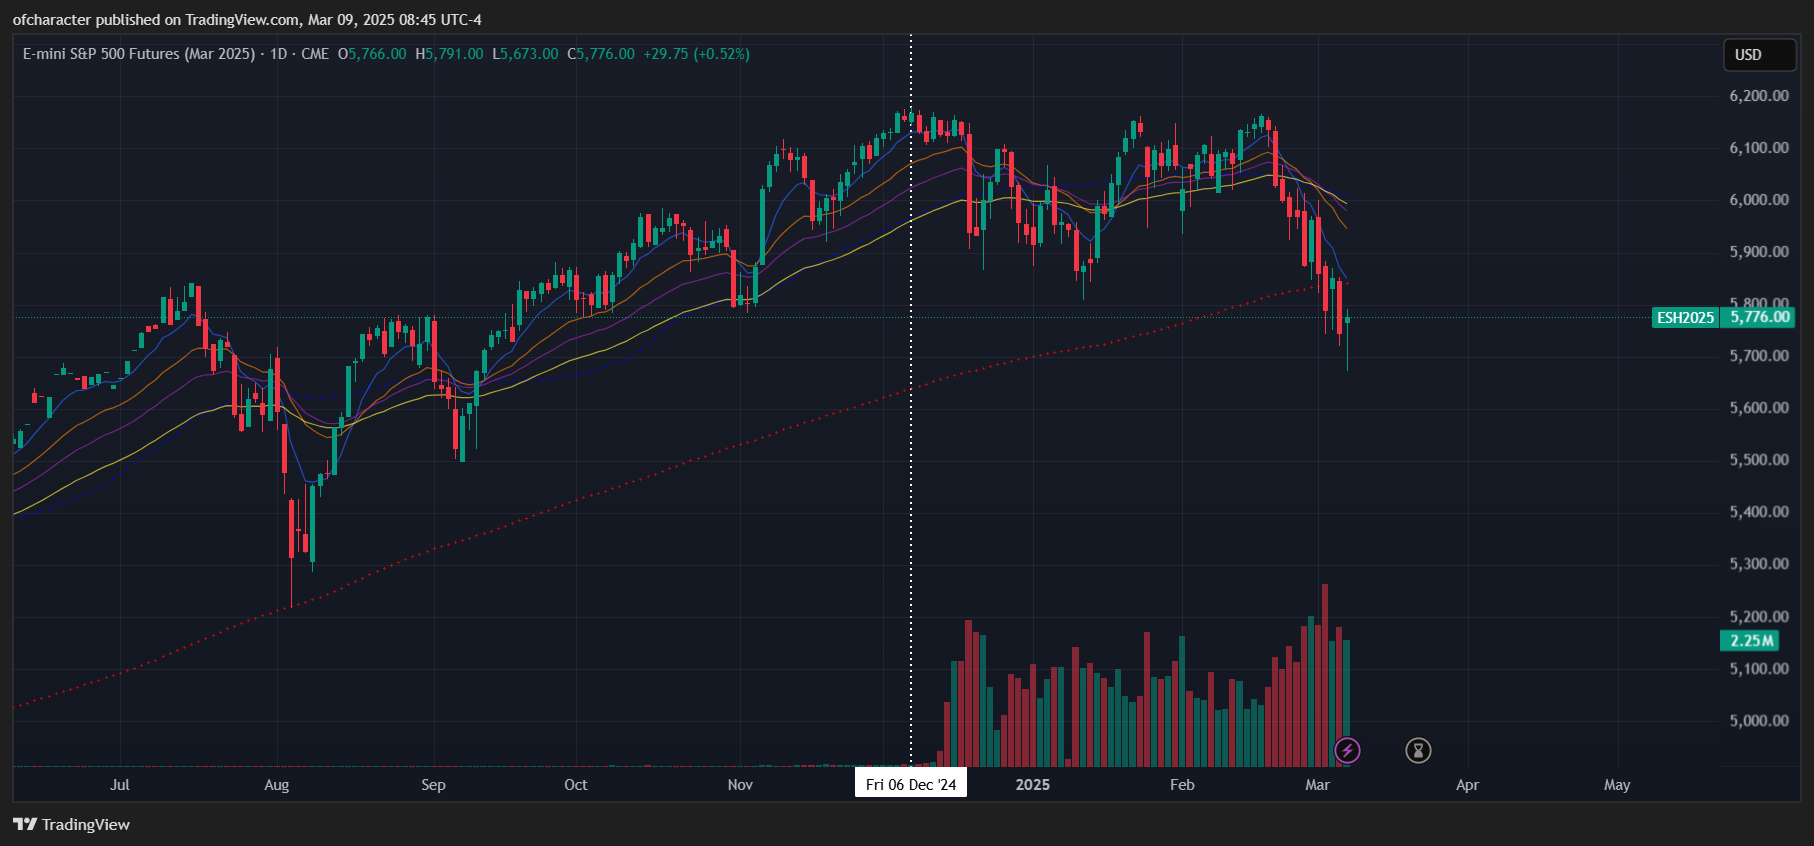
This recent sell-off seemed more gamma/positioning driven than macro. 50% of the long gamma position in SPX rolled off after Feb OpEx, leaving the market to move freely shortly after. Couple that with an almost certain significant upside trajectory for vol, and you have fireworks. Per Nomura, a day ahead of Feb VIXperation:
Retail, of course, happily BTD into this setup while institutions sold. Per GS’s Scott Rubner:
The largest retail buy imbalance in the history of GS dataset (starting in 2019) took place on Jan 17 at $5.03 Billion. This dataset includes covid times.
Monday, Feb 3, was the second largest retail imbalance at $4.89 Billion.
Tuesday, Feb 4, was the fifth largest retail imbalance at +$4.23 Billion.
Four of the top five retail imbalances took place in the last two weeks, signaling record dip-buying.
As of Feb 28th, per GS:
Retail purchased equities for 28 straight days from January 10th to Feburary 20th.
This included 4 of the top 5 largest retail imbalance days in the history of our data set.
I would describe the trading style as a fundamental “buyers strike” and overwhelmingly a systematic and quantitative trading environment. This was the fastest -5% decline from an all-time high for the NDX Index since September 2020.
AAII Bearish sentiment recorded the 4th "most bearish" reading in 30 years. Other 3 instances: September 2022, March 2009, October 2008.
That last point is my favorite. The week before that, I saw that AAII survey floating around as proof that equities were going to go through the roof. No better time to remember that positioning is everything.
Fragility, The Macro Way
Having made several mentions of the glaring similarities between now & the 70s — deglobalization, ever-increasing geopolitical conflicts, trade protectionism, and (most importantly) an asymmetric Fed in an environment highly susceptible to negative supply shocks —, it feels like there’s not much to add here. Nonetheless, top of mind:
Fiscal profligacy decreasing — courtesy of the DOGE.
Tariffs.
Relative CB policy.
Elevated policy uncertainty.
I’ll conclude this section with a note from before DT’s inauguration:
There is presently a pervasive belief amongst overzealous DT supporters that DT will not only make America great again, but he will also do so in the blink of an eye & without any pain. This doesn’t check out since the average supporter also believed that the current state of the economy was exceedingly poor. If Trump is truly being handed a bag of sh%! covered in gold, wouldn’t it naturally take time and some pain to remedy the US?
Really, It’s All One Trade? So…What’s The Trade?
Time for a positioning update. It will be my last one.
Apr NVDA puts entered 1/7. Jun NDX puts, Mar NDX put spreads, and a Yen long all entered 1/23. May FXI calls entered 1/24. Apr VIX call spreads entered 2/18. And May NVDA puts entered 2/27. All have been trimmed to my liking. Intermission is almost over for energy/oil.
As for what can come next:
JGBs will continue getting sold, and the yen will continue to strengthen as the BOJ is extremely behind the curve like the Fed was in late '21. Needless to say, the Nikkei will not benefit from this development.
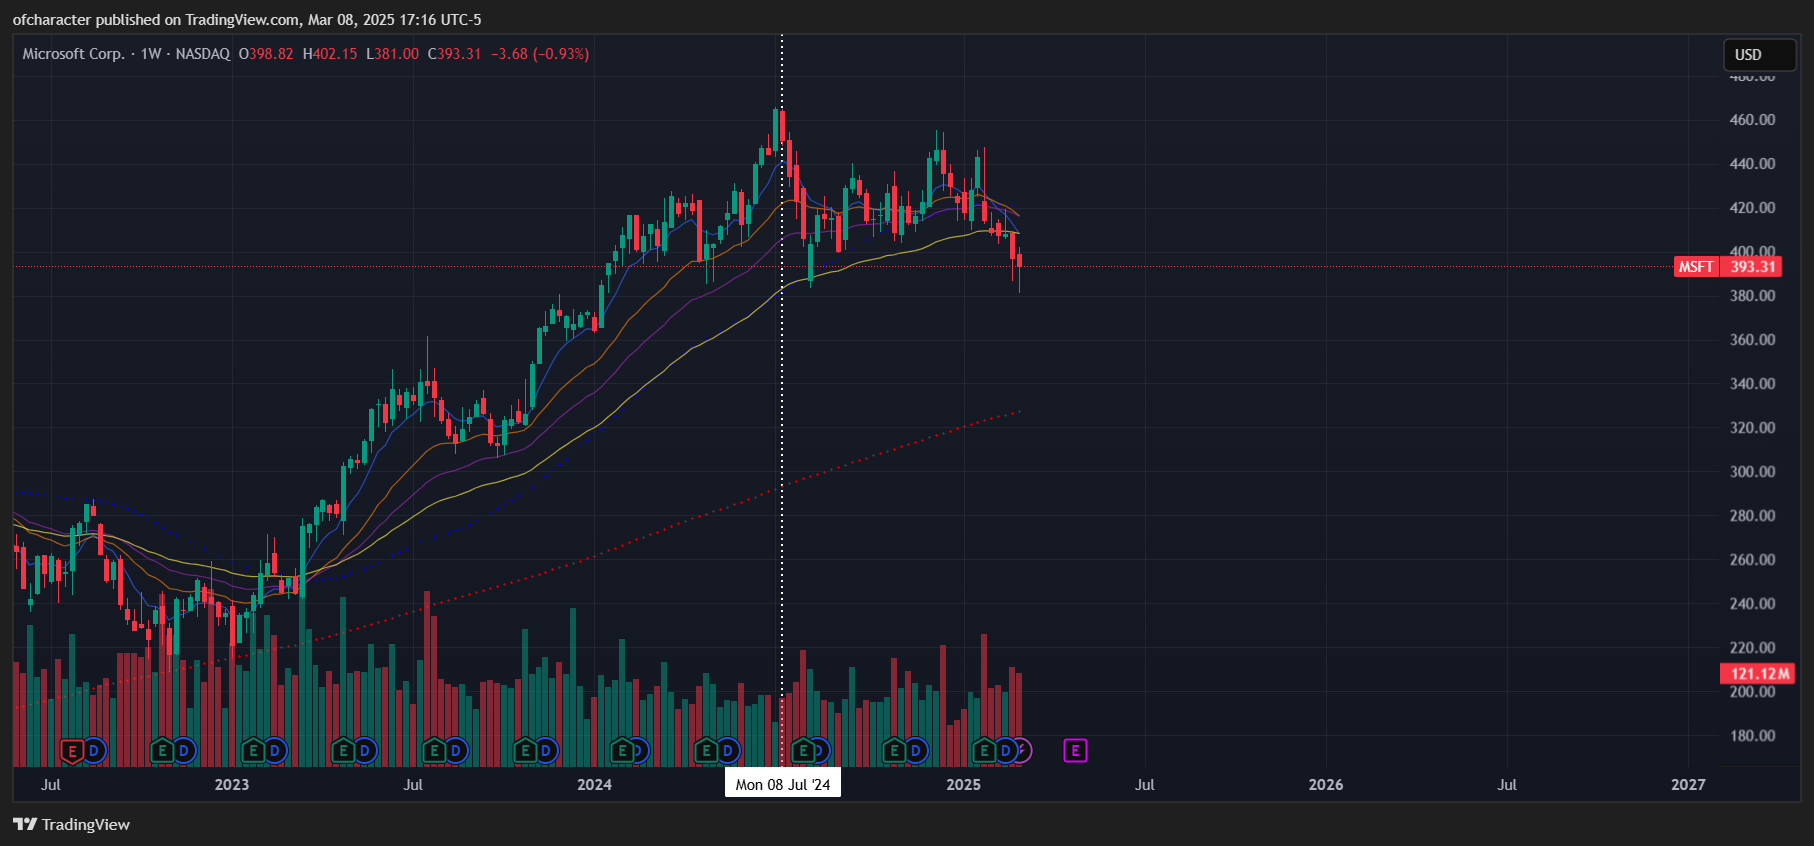
DeepSell (lol) turned Mag7 into “Lagnificent 7” and China is not implementing contractionary policy like the other major CBs. Smells like peak US exceptionalism should this persist.
Don’t fall asleep on energy & oil. Bottom of multi-year range, global inventories historically low, US crude production’s likely peaked & due to roll over. Paper markets still trump fundamentals for now, algos don’t check for validity or feasibility of headlines. Barring any exogenous events, crude remains rangebound for the foreseeable future.
US long-end is more responsive to growth for now. This is subject to change — fade extremes.
USD will continue to weaken — reminder that this isn’t always positive for equities.
Until next time,
Pierre
“And not only that, but we also glory in tribulations, knowing that tribulation produces perseverance; and perseverance, character; and character, hope.” — Romans 5:3